
COVID-19 Dashboard 🤒
With all the news outlet talking about coronavirus, it gets hard (personally) to decide which outlet is truthful or just manipulating the data. This dashboard was created with the idea to create an objective view of the coronavirus with real-time time data updated daily from proper officals.
This dashboard focuses mainly on California and then World since in the begining I was for personal, but later on it could be expanded.
Data Preparation
The most important part of this project was the data source. The data used for this project comes to validated and the proper sources.
The California data is from the publicly avaiable dataset hosted by the California Gov’t.
The World data is aquired from the Our World In Data which relies on the Europen CDC:
Project Design
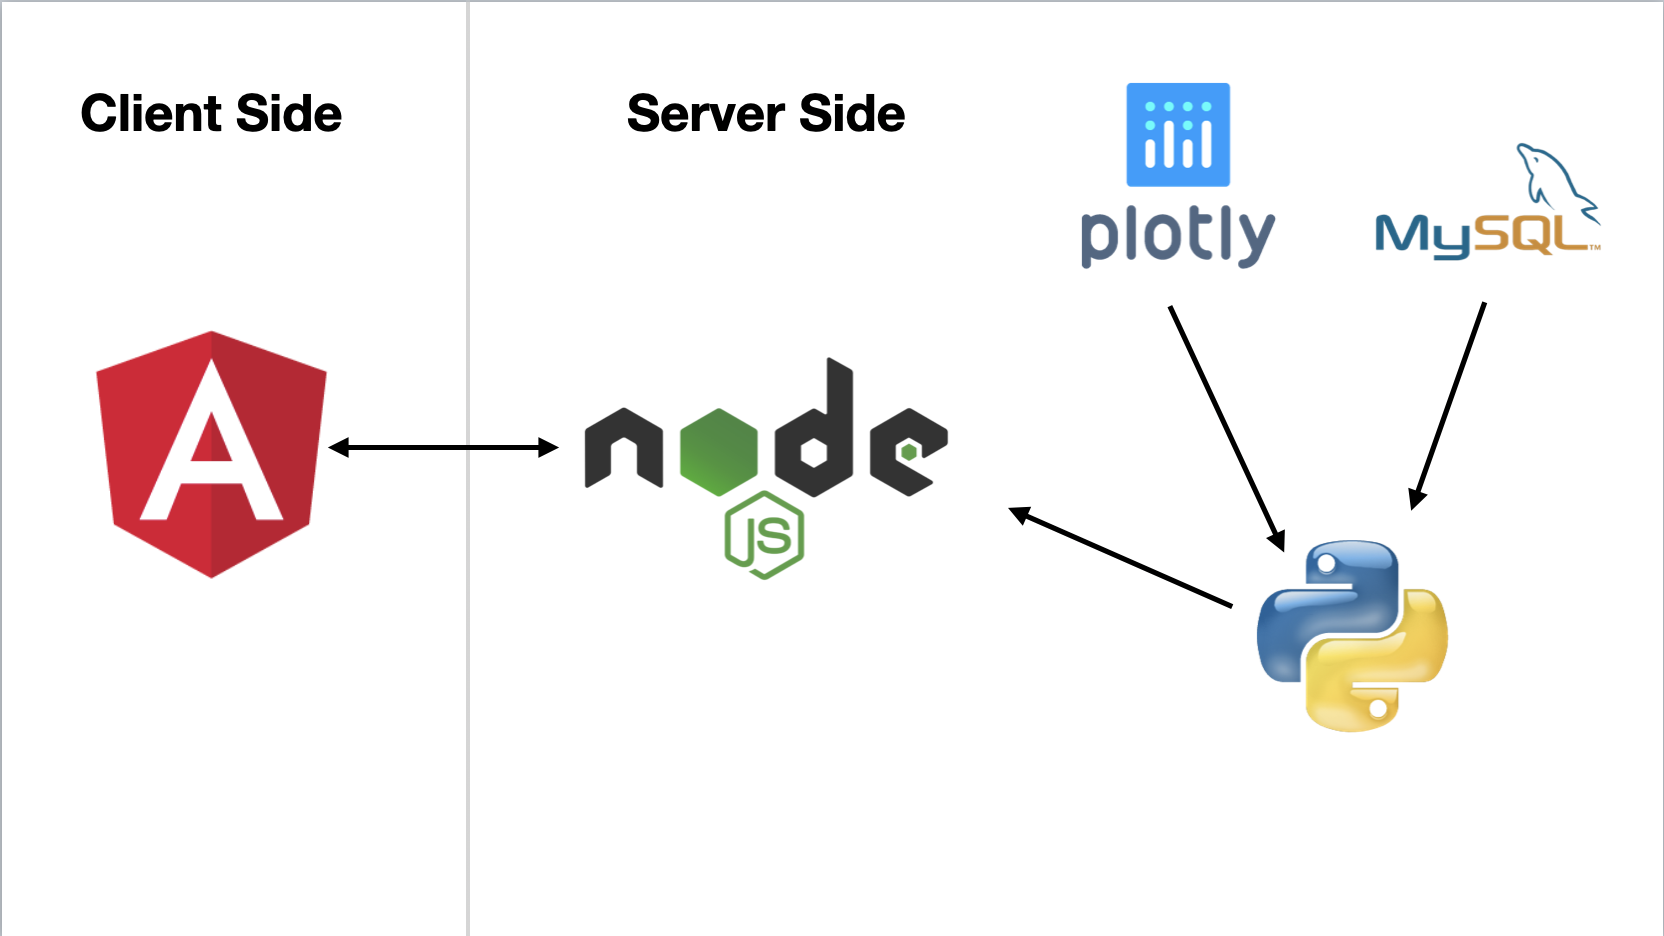 :
:
California Dashboard
This dashboard is specific to the state of California. Based on your zipcode, the corresponding data will be curated to visualized for you to view. You can also different visualizations of the state data as well. Below is the youtube video demo showcasing the dashboard. Click on the video below for a little demo!

Wolrd Dashboard
This dashboard is specific to the world. Data is currated so you can see the top countries affected and toggle through the plots. You can also search specfic countries to view data specific to that country. Click on the video below for a little demo!
